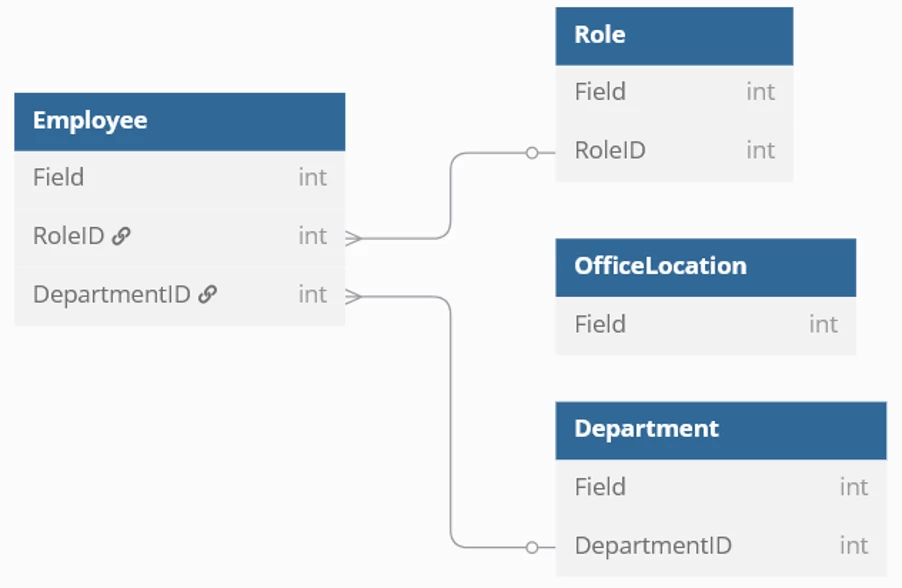
Please note that the LeanIX data model consists of
fact sheets, which have fields that are by definition not related to other fact sheets, and
relations, which form the connection between two fact sheets.
The picture you lined out looks like a relational model, whereas LeanIX is based on a graph database which looks slightly different. In the graph database, Fact Sheets are nodes and relations are edges, and a field can either sit on a node or on an edge.