SAP Logo LeanIX is now part of SAP
Question

Data Flow Diagrams

  • 29 February 2024
  • 7 replies
  • 179 views

Is there anyone doing Data Flow maps? If so, can you please help me how to get started? I’d like to do simple data flow connecting multiple applications with arrows indicating the data that flow between them, in which direction etc. I tried to read the Data Flow article but it is not very helpful as it simply just assumes that you already have all the relationships maintained and only focuses on how to visualize it.


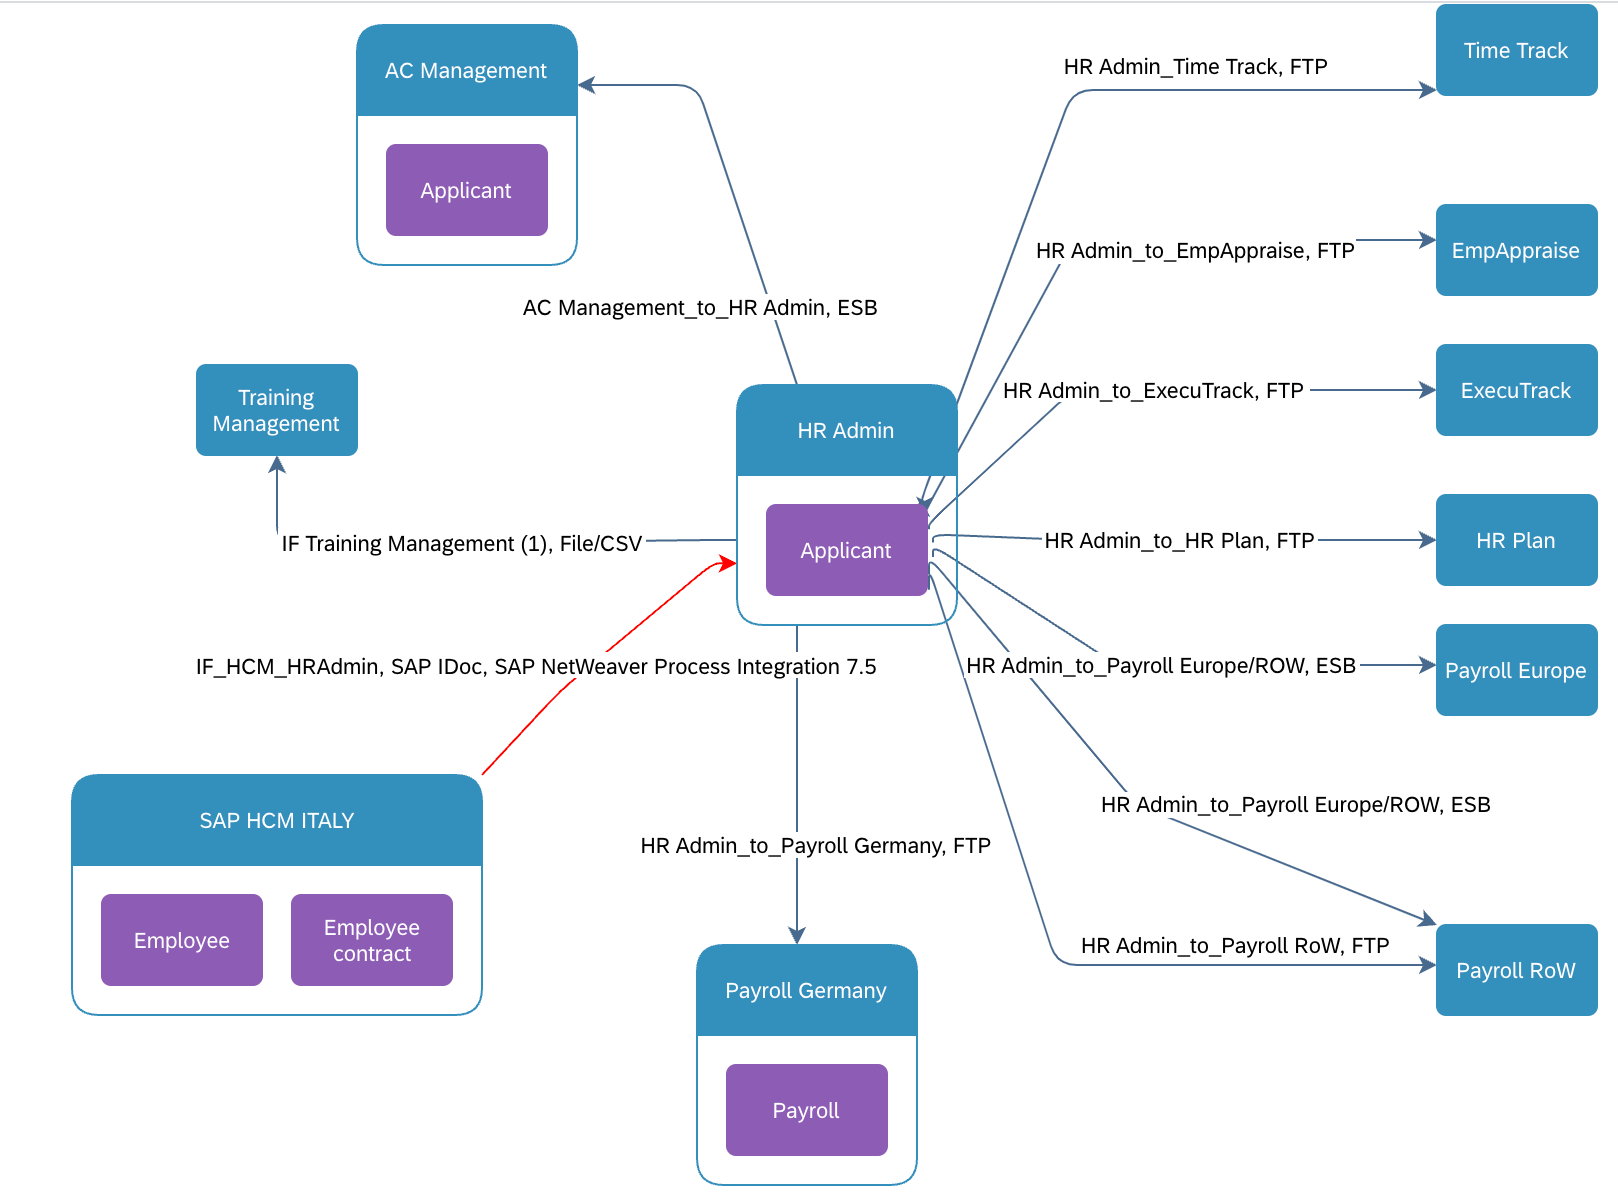
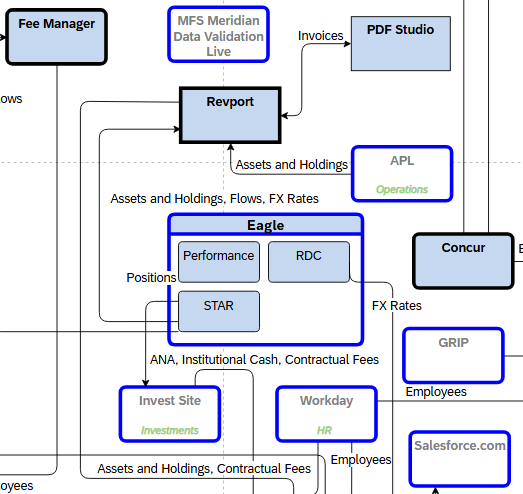
What I am looking for is how to really start from scratch - e.g. imagine I have 2 fresh application fact sheets and I want to add them to Data Flow diagram, then draw an arrow between them and on the arrow then maintain the ‘data flow attributes’ - direction, data content, maybe the method/protocol etc. I did not find easy way how to do it directly in the diagram.


Any input / guidance welcome.


BTW it is also unclear to me what is the real difference between Free Draw and Data Flow diagram editor - they seem to look exactly the same. Again, the official articles are not very helpful as they just describe when to use which but not what is the actual difference (features, limitations...) of each of those. To me it feels that I can technically do the same in both - would be great to have ‘real comparison’ of those two somewhere.


7 replies

Morning Merlin,

This is something I’ve just started looking at also. There will most likely be a more qualified answer from someone else but in the interest of passing on the little I know I would go about this as follows.


In your example of two applications I would suggest that you forget about the visualization in the first instance. Instead start to build out your model using additional Fact Sheets of the “Interfaces” that the Applications Consume/Provide and the “Data Objects” that are transferred from object to object.


By building this model out you’re leaving yourself with a robust inventory that will remove the complexity of the visualization and in turn will allow you to reference the inventory components (Fact Sheets) in your visualization later.

I think you could do this the other way around but for my personal way of thinking it’s easier to get your ducks before you put them in a row! 

Userlevel 1

I second the response from @TMorgan since you can also use reports and dashboards down the line to provider insights to your stakeholders other than Data Flow diagrams.

Besides, distributing the work and maintaining ownership of the data in LeanIX is better served this way via Surveys based on Applications and Interfaces for example to keep your data quality high.

Userlevel 1

I agree - it's much easier to import the data and make the associations in data and then visualise the data flow - see attached view


Thanks for all the answers. This is exactly what I was afraid off - that even simple ‘arrow’ between two applications will have to be first done via creating multiple fact sheets in the background. My concern is that this is not user friendly. We would like the data flows to be done by ‘normal non-IT people’ and I’d like to give them capability to do it visually - just add boxes for the applications in their space onto the canvas and start drawing arrows between them with maintaining the metadata for those arrows… which would then in the background create / link the necessary fact sheets. This is how most people are used to do modelling / drawings today… So I understand that is not possible, right?

Userlevel 3
Badge

Hi merlin,

If you’d like to give individuals the ability to simply add shapes/boxes for applications, draw their own arrows, and then link fact sheets, our Free Draw Diagrams will be best suited for this, rather than the Data Flow Diagrams.  I am providing a link to our documentation on Free Draw Diagrams here


Based on my understanding of your description of what you desire, this should be easily achieved with Free Draw Diagrams, as one of the intents of this diagram type is to start with a visual and then link your fact sheets accordingly.  Let us know if you have further questions here!

Hi Danielle,

yes, I am very clear on that for ‘boxes’ (that can represent applications) - and we already do that. Now we want to start documenting the data flows (= arrows between the apps). Our hope was that we can simply  do it in the Data Flow diagram - draw the arrows, then have some window to edit properties (like direction, data content, format, etc.) and it would create all the necessary data structures (fact sheets - interfaces etc.) in the background. So basically similar to what people above suggested but do it in the visual editor itself in simple, intuitive, user friendly manner vs. having to first do all the hard work in the background ‘manually’ and only then visualize it in Data Flow diagram. So in short, have the Data Flow diagram as a way to BUILD those data flows vs. just to VISUALIZE the relationships that have to be done in very manual way via creation of different types of fact sheets, linking them etc.

Userlevel 3
Badge

Hi merlin,

Ah, I see - thank you for clarifying - I think I have a much better understanding now.  In the Data Flow Diagram type, you are hoping to be able to add a box/shape (or an arrow, for that matter), right-click on it, and link to a fact sheet (for define the direction of the data flow), similar to the capabilities that we have available in the Free Draw.

You are correct in that we are not able to achieve this type of editing in the Data Flow Diagrams - only the Free Draw.  I would recommend submitting an idea to our Product Roadmap with this request, and you can rank how critical the feature is to your organization.  I will note that Diagrams are a feature that we have invested heavily in as of late - we introduced our Next Gen Diagrams editor (which you are now using) and we’ve had a number of feature releases since.  We welcome any feedback, so please do feel free to submit your request for our Product Team to consider.  Thanks for posing the topic!

Reply