SAP Logo LeanIX is now part of SAP
Question

Newbie question on how to list both applications and components at the same time

  • 18 March 2024
  • 6 replies
  • 154 views

Userlevel 1

Hello,

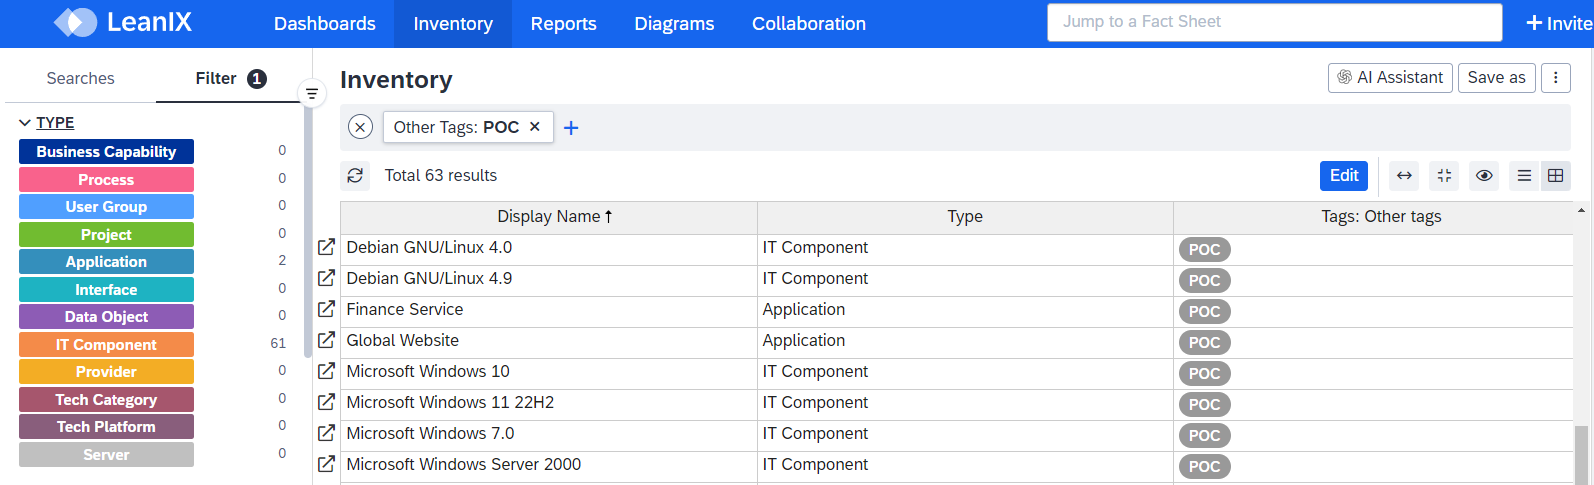
From seeing many views, lists  and reports, it seems to me that out-of-the-box, one can only list either applications or components at the same time, not a mix of both.
If true, what would the rationale be on this? 
I could understand that not all fields or tags can be listed in the same list if different types of objects does not have the same ones, but given that some fields or tags ARE shared by all objects types it seems to make perfect sense to be able to list them in one single list.

A bit like having a list called “Fruit basket”, it listing all kinds of fruits you have and then showing shared properties of these kinds. You don’t have to know in advance what fruits you have as all kinds will be listed assuming there is no other filtering. The list can then be exported to Excel for further analysis.
This seems way more dynamic compared to having to make a separate list for each fruit type, exporting each list to Excel and then trying to merge lists in Excel.


6 replies

Userlevel 6
Badge +2

Hi @Davidson 

In the inventory, you can usually export fact sheets of multiple fact sheet types. The only thing you need to make sure is to define your filter so that you only export those fact sheets that you really want to export:


If you like, you can use a temporary tag for this filter. If you want to export all applications and IT components, you could easily assign a new tag called “Apps and Components” in the tag group “Export” by running this script in LeanIX Console:

for app in Application.all():
app.add_tags({"Export": ["Apps and Components"]})

for itc in ITComponent.all():
itc.add_tags({"Export": ["Apps and Components"]})

Then you can just filter for this tag and run an Excel export.

Userlevel 5
Badge +1

Hey @Davidson,

The rational behind it is that for a fruit basket LeanIX needs to identify what you consider being a fruit?

Therefore, for a few attributes common to all Fact Sheets there are filters in the inventory available without selecting a Fact Sheet type first. With these, you can actually create a list of multiple Fact Sheet types (Application, IT Component, an others). For example, list all Fact Sheets a user is subscribed to, or a list of Fact Sheets with certain tags.

In similar situations others have used tags to classify certain Fact Sheets of different types.

Userlevel 1

Hey @Davidson,

The rational behind it is that for a fruit basket LeanIX needs to identify what you consider being a fruit?

Therefore, for a few attributes common to all Fact Sheets there are filters in the inventory available without selecting a Fact Sheet type first. With these, you can actually create a list of multiple Fact Sheet types (Application, IT Component, an others). For example, list all Fact Sheets a user is subscribed to, or a list of Fact Sheets with certain tags.

In similar situations others have used tags to classify certain Fact Sheets of different types.

Hello,

Well, it think it may make good sense to list - for example - everything you own and have in the fruit basket. Filter may help set the scope well enough that far.
If you happen to have something else in the fruit basket than fruits or is not sure of definitions, the open ended list will show everything which in many cases would be very useful. It will help you explore what you have in the fruit basket, including anything not being a fruit. Categorization of the list export can be done in Excel.
The point is that you don’t know exactly what you have but want to list what you have in one go. Actually, I think that it makes perfect sense and would be something that many would like to be able to do. Being able to include any kind of object in the same list or report seems like a basic feature and would probably decrease the number of lists.

Fruit basket analogy aside, if my organization owns a number of applications and a number of component objects and someone want an overview of what they own, it seems to make perfect sense to have one single list instead of two.
I have not seen it is possible to include both Application and IT component at the same time but it seems I must have missed something. Will take another look!

Userlevel 1

Hi @Davidson 

In the inventory, you can usually export fact sheets of multiple fact sheet types. The only thing you need to make sure is to define your filter so that you only export those fact sheets that you really want to export:


If you like, you can use a temporary tag for this filter. If you want to export all applications and IT components, you could easily assign a new tag called “Apps and Components” in the tag group “Export” by running this script in LeanIX Console:

for app in Application.all():
app.add_tags({"Export": ["Apps and Components"]})

for itc in ITComponent.all():
itc.add_tags({"Export": ["Apps and Components"]})

Then you can just filter for this tag and run an Excel export.

Hello, 
Thank you. I guess I must have missed something. I looked around a lot but failed to see any obvious way to include both Applications and Components. What you speak about and show here just does not seem possible, but I will look again.
Interesting work around with a temporary tag. Had not considered that at all. Thank you.
I may have missed something here, but it feels like it should be way easier to do what I am looking for. Perhaps it is something in our particular implementation. Oh well, I will have another go.

Userlevel 4
Badge

@Davidson I am afraid there is nothing satisfactory within the LeanIX application itself. Faced with a use case to provide an organisation with a combined list and visualisations about their used Applications  and IT Components the only viable option was to use the OData Integration for Power BI and Tableau (leanix.net).

Here it is possible to create two table views as saved searches, one for Applications and one for IT Components, with both exposing the organisations using them. These OData feeds can then be used in the reporting tool and joined to provide one seamless view.

A little bit of initial effort but more sustainable than merging separate excel spreadsheets.

Userlevel 1

@Justin Swift Hello. Thank you for the clarification/confirmation and for that link!
I was not aware of OData Integration.

The issue was perplexing. It seems to be such a basic, self-evident, thing to be able to do.
To be frank, I can not see how it could not be seen as better to be able to list both in one go.

I have not been able to recreate the functionality of listing both with the input given by others saying (as I understands it) it is possible.
Very frustrating. Again, it seems like such a basic, natural, thing. My general feeling is that most other products I have worked with supports this seamlessly.

The tool should include the ‘muscles’ to do these kind of things with a minimal effort of a power user (and without additional 3rd party products).

Reply