

A well-modeled Fact Sheet is the foundation of every valuable insight in SAP LeanIX. Whether your goal is transparency, rationalization, reporting, or long-term governance, data quality directly determines the quality of your outcomes.
This article explains what makes a Fact Sheet “good” and how to structure data for consistency, clarity, and sustainable governance from day one of onboarding.
1. Understanding the purpose of Fact Sheets
Fact sheets are not simply data-entry forms. They are structured architectural objects that describe your applications, capabilities, technologies, or other elements of your IT landscape.
Their value comes from:
- The information they contain
- The relationships they form
- The ownership behind their maintenance
- The frequency and accuracy of updates
LeanIX evaluates the completeness and quality of Fact Sheets based on a set of weighted attributes, relations, ownership elements, and activity history.
A good Fact Sheet is therefore both technically complete and actively governed.
2. The Core Characteristics of a High‑Quality Fact Sheet
Completeness
Each Fact Sheet includes attributes and relations contributing to a completion score. Administrators can weight critical fields more heavily. Attributes and relations count toward completeness; tags do not.
A complete Fact Sheet contains enough information for both users and LeanIX reports to generate meaningful insights.
Connection
Fact Sheets are most valuable when connected to other elements of your architecture. For example, an Application gains meaning when it is linked to:
- The Business Capabilities it supports
- The Organizations that use it
- The IT Components it runs on
These relationships are essential for reporting, impact analysis, and roadmapping.
Ownership
Subscribers define responsibility. A Responsible or Accountable subscriber can approve the Quality Seal. Observers can comment but cannot approve it.
Changes made by users other than Responsible or Accountable subscribers break the Quality Seal and trigger a review. However, changes made by Admins do not break the Quality Seal, and Admins can approve any broken seal even if they are not subscribed.
Strong ownership ensures that data is not only entered, but also maintained. Check out our documentation about Fact Sheet subscription.
Freshness
LeanIX tracks inactivity. If a Fact Sheet remains untouched beyond the defined renewal interval (30 days, 3 months, 6 months, or 1 year), the Quality Seal breaks automatically. This mechanism prevents data from becoming stale and unmanaged.
3. The Most Impactful Application Attributes
While each organization ultimately decides which fields matter most, LeanIX experience shows that the following Application attributes consistently generate strong architectural insight.
Important note: Some of the fields below (such as Business Criticality, Functional Fit, and Technical Fit) are judgement-based. To ensure consistency, many organizations collect this data through standardized surveys rather than manual input.
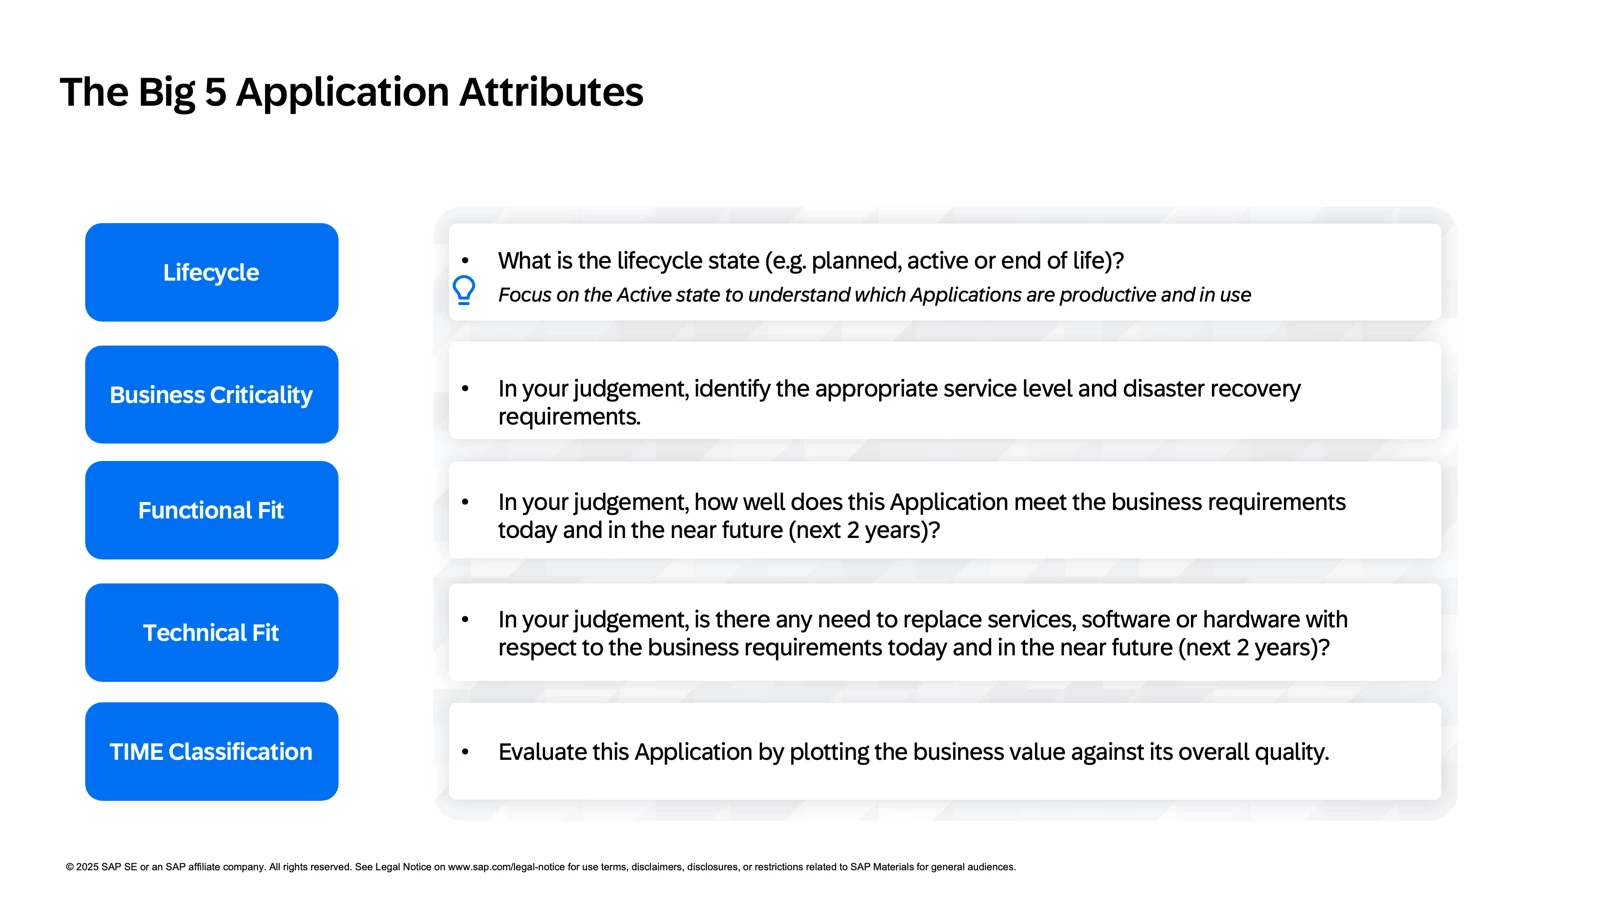
Lifecycle
Defines the state of an application based on its usage in the organization: Plan, Phase In, Active, Phase Out, or End of Life.
During onboarding, focus on marking applications as Active only. Missing start dates should not slow onboarding. Use a simple placeholder (for example, today’s date or January 1st). More granular lifecycle states can be introduced later.
Business Criticality
Ranks applications based on their importance to business operations. Identifying mission-critical and business-critical applications supports many EA initiatives and reporting views.
Since this is subjective, it is commonly included in surveys sent to Application Owners, using indirect questions to derive a consistent score. Check out here how to evaluate it.
Functional Fit
Measures how well an Application supports business needs and enables its related Business Capabilities.
Instead of asking owners to judge fit directly, a recommended approach is to use a scoring framework based on indirect survey questions, such as:
- How frequently is the application used?
- How well does the application support daily work?
- How much manual effort does it reduce?
Responses can then be translated into a standardized Functional Fit score. LeanIX provides a ready-to-use survey template in the LeanIX Store to support this approach.
Technical Fit
Assesses how well an Application aligns with technical standards and strategy. Criteria may include:
- Cloud alignment
- API availability
- Security standards
- Compliance requirements
Like Functional Fit, this is best evaluated through a structured scoring framework.
TIME Classification
Gartner’s TIME Classification is a very popular classification for portfolio strategy. LeanIX can automatically compute this classification based on the Functional Fit and Technical Fit using the Calculations feature.
These fields quickly elevate the analytical value of your portfolio.
4. Mandatory Elements and the Quality Seal
The Quality Seal is LeanIX’s built‑in governance mechanism. It signals that a Fact Sheet is complete and approved. The seal breaks when:
- A non-responsible user modifies the Fact Sheet
- The Fact Sheet is not updated within the defined interval
A Fact Sheet remains in Draft if mandatory attributes, relations, or subscriber roles are missing. In this state, the Quality Seal cannot be approved.
Mandatory elements improve consistency but should be used carefully. Too many required fields can slow adoption.
Check out our documentation about mandatory attributes.
5. Relations as the Backbone of the Model
High-quality Fact Sheets rely on intentional relationships. They are essential architectural connections.
Examples include:
- Applications related to the Business Capabilities they support
- Applications related to the Organizations that use them
- IT Components related to the Applications they run
- Business Capabilities structured in a parent–child hierarchy
Tip: Keep capability hierarchies simple—2 to 3 levels deep, with 5–10 elements per level.
Here is an overview of our Meta Model and the relations between the Fact Sheet. Relations require the relevant Fact Sheets to already exist in your workspace.
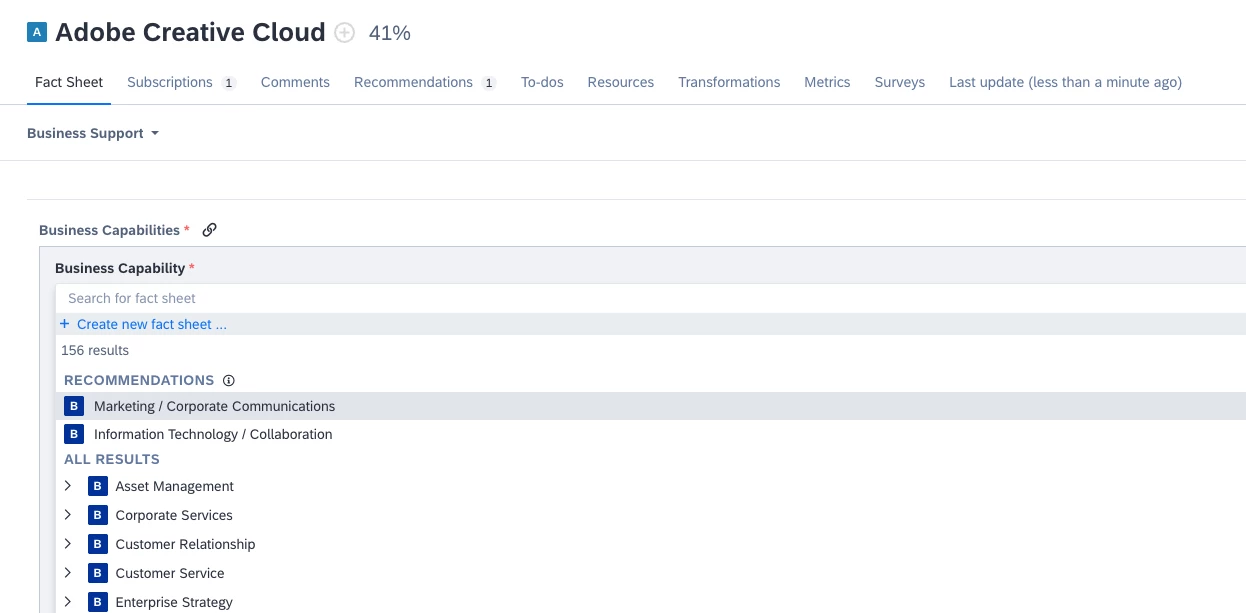
You can create these relations directly inside the Fact Sheet :
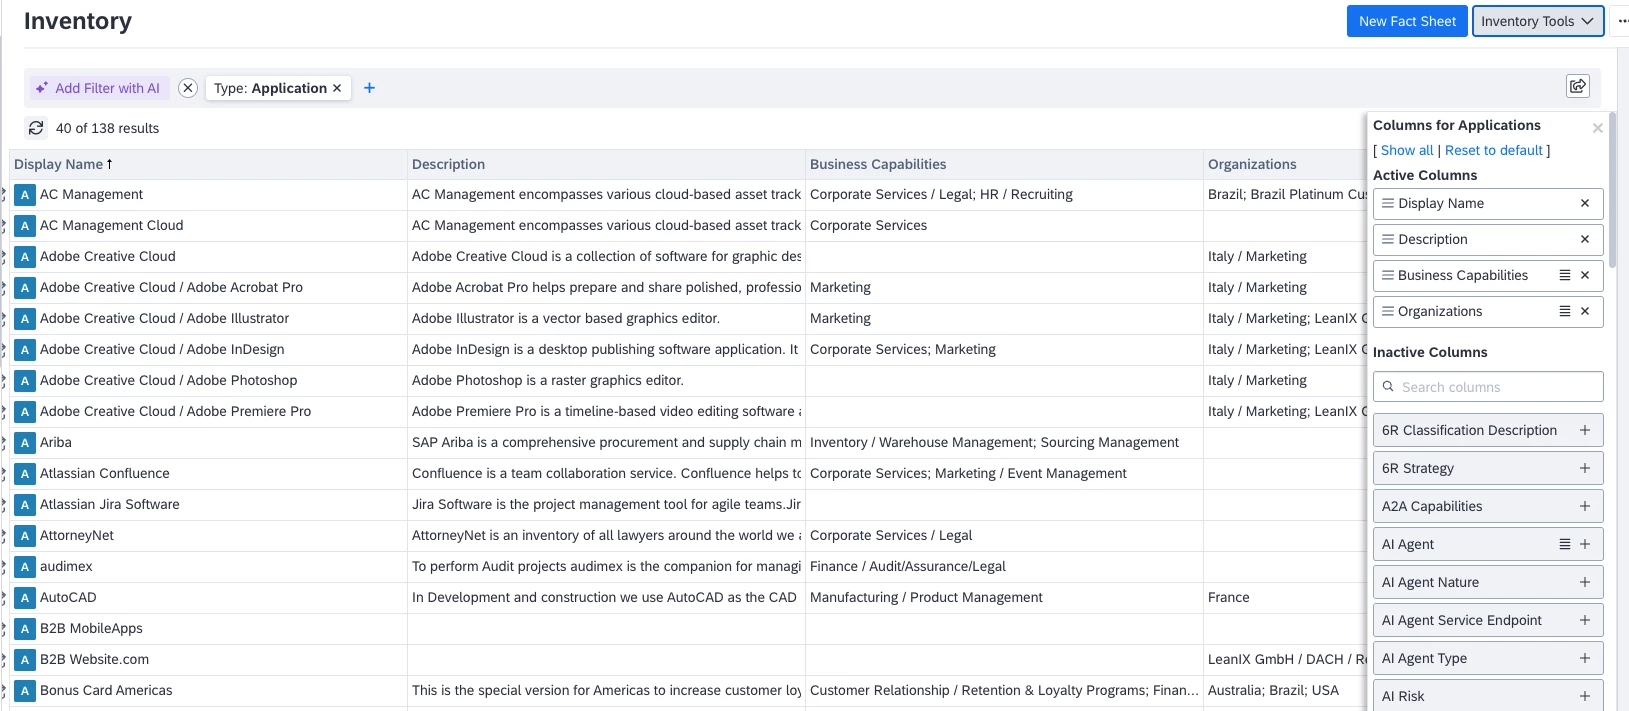
Or using the Excel template. First, select the Fact Sheet type (in this example, Applications) and then choose the relations you want to create for those Applications, such as Business Capabilities or Organizations.
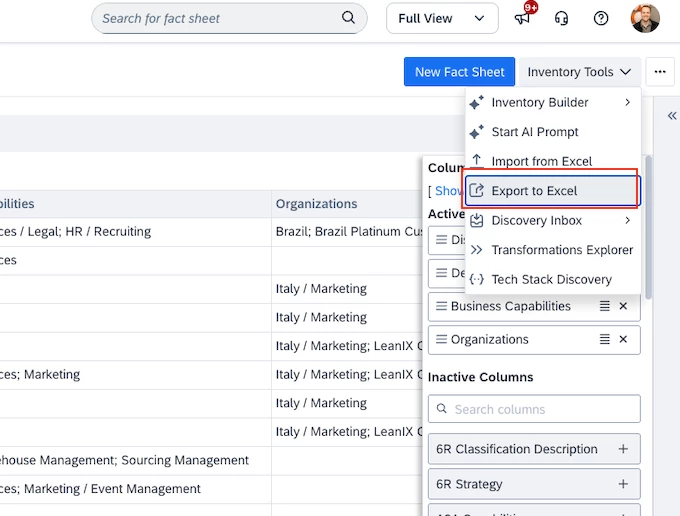
You will then need to click on Export to Excel, create your relations, and do an import again. Check out our documentation on how to import fact sheet data though excel file.
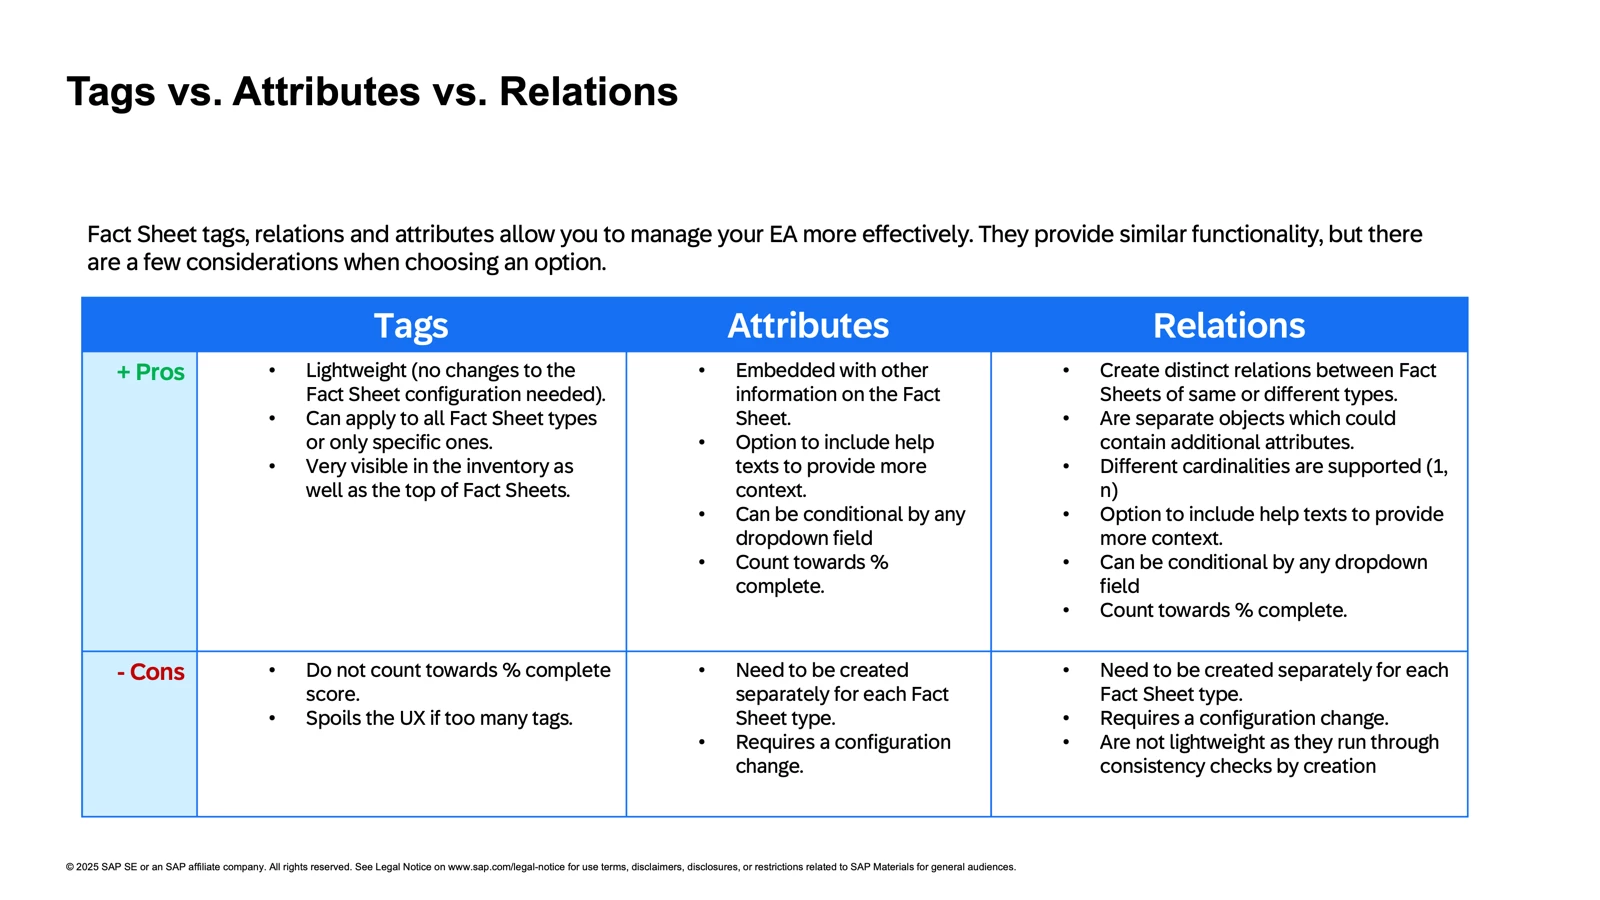
6. Using Tags Without Overloading the Meta Model
Tags are useful for quick categorization and filtering, but they are not structured data.
Key differences:
- Tags do not contribute to completion
- Tags appear in the Inventory view
- Attributes allow more detailed and structured input
Both tags and attributes can be used in reporting, but overusing tags can create noise. Use them selectively. Here is a quick overview on when to use Tags, Attributes or Relations :
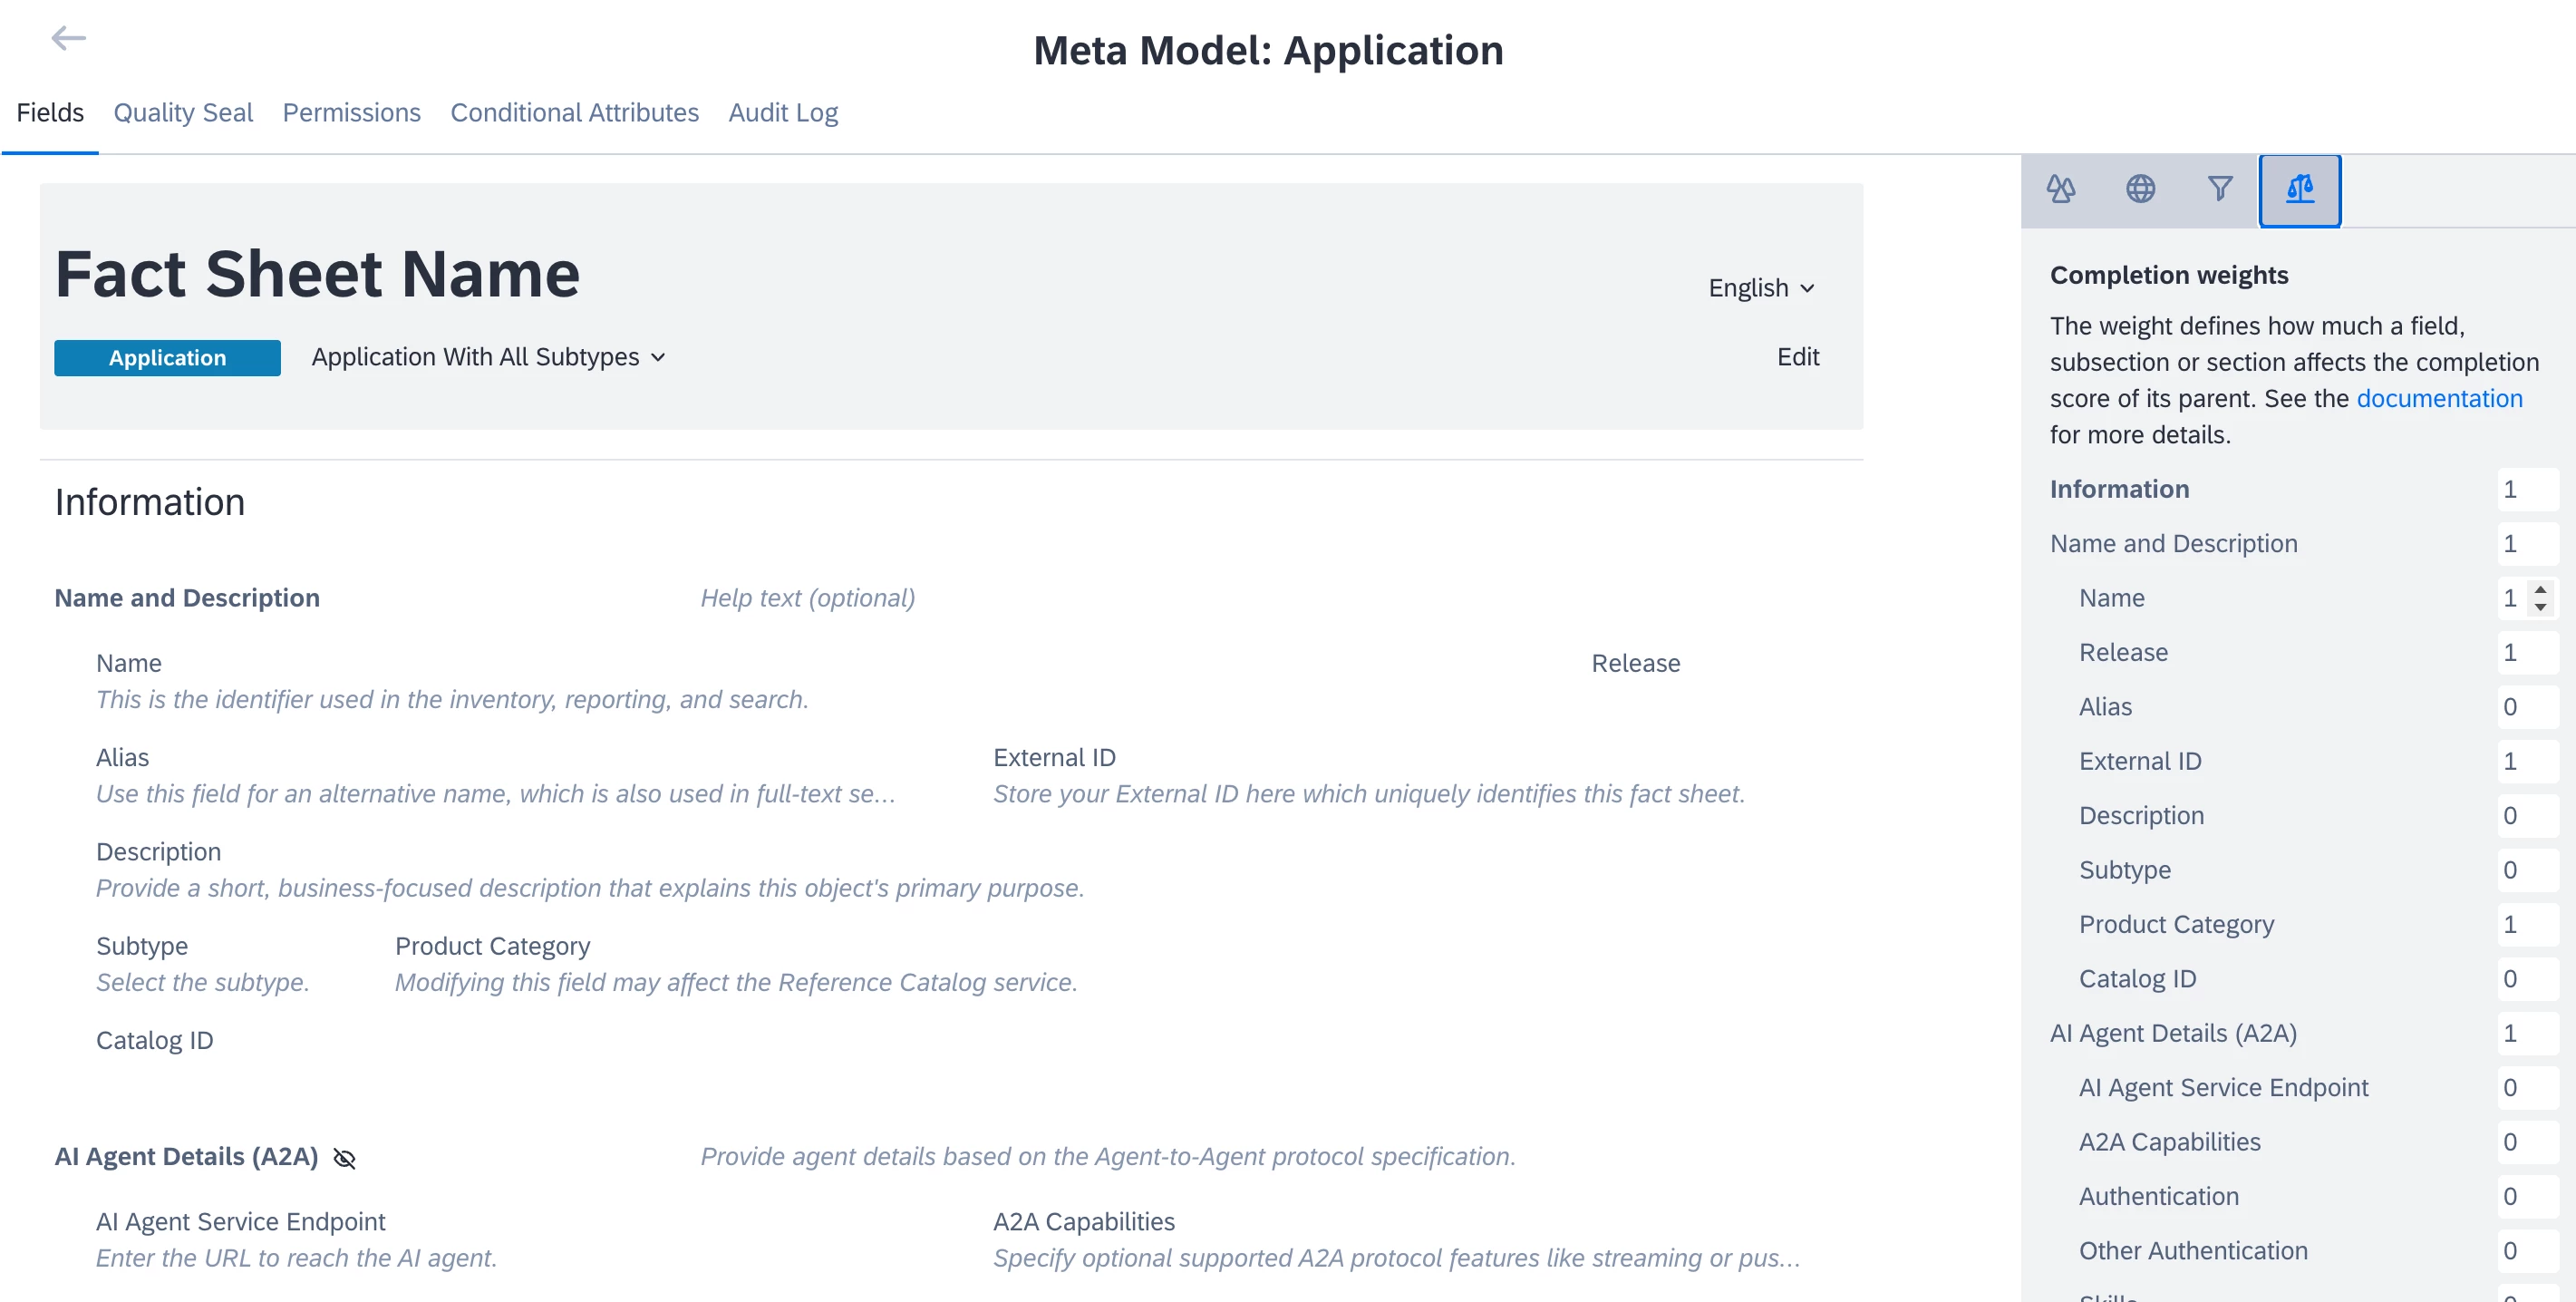
7. Completion Weight and Why It Matters
Completion weight defines how much each field or section influences the overall completion score. It helps highlight critical data, identify gaps, and visualize data maturity.
Rather than aiming for 100%, successful customers prioritize quality over quantity. Even very mature LeanIX customers typically reach 75–85% completion, focusing on what truly matters.
Best practices include:
- Assigning higher weights to truly critical fields
- Avoiding too many weighted elements
- Hiding unused sections
- Reviewing completion weights during onboarding
Check our documentation about Fact Sheets Completeness.
To change the completion weight, head to the Meta Model Configuration section of the administration area.
8. Keeping the Meta Model Lean During Onboarding
LeanIX is highly customizable, but adding complexity too early can reduce data quality.
During onboarding:
- Hide non-essential attributes
- Delay custom fields until needed
- Limit capability hierarchies to three levels
- Focus on Applications, Business Capabilities, and Organizations
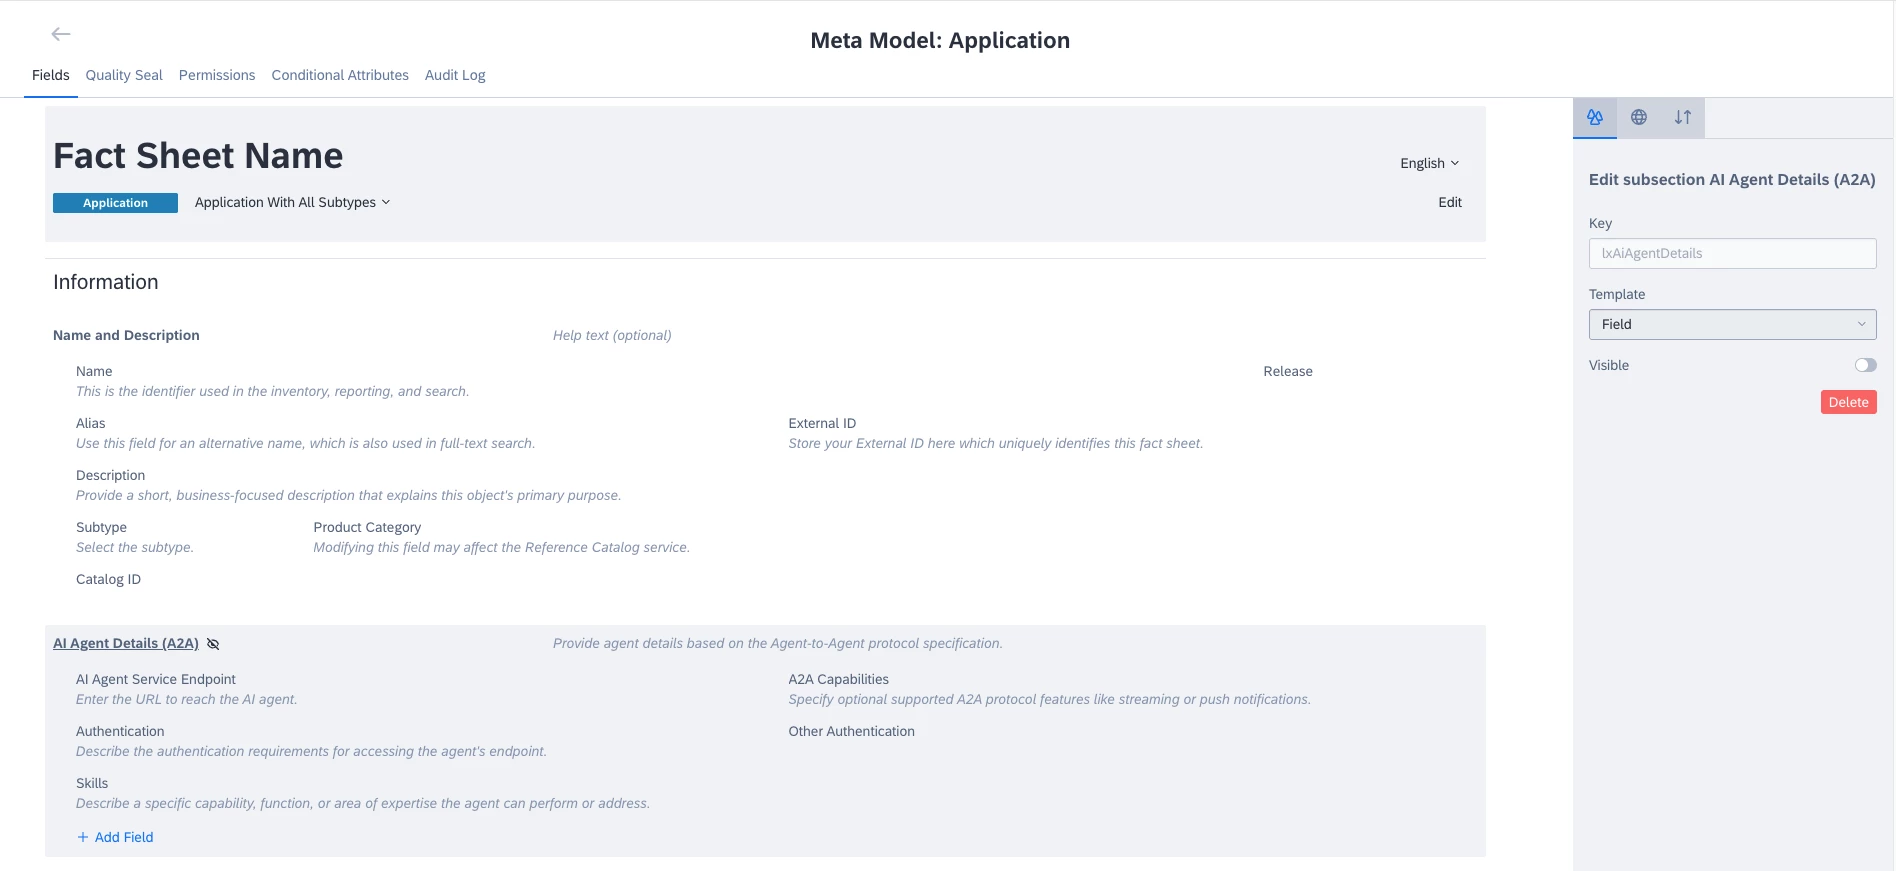
Hidden sections do not count toward completion and reduce cognitive load, improving usability and adoption.
Just like for the section above, head to the Meta Model Configuration section in the administration area. Select the Fact Sheet type you want to modify, then click on a section or subsection and turn off the Visible toggle in the right-side panel. Finally, save your changes.
Note that it is not possible to hide a single attribute—only entire sections or subsections can be hidden. If you need to remove just one attribute, you will have to delete it.
Tip: Stick to standard configurations whenever possible to follow best practices and simplify governance.
9. Putting It All Together
A good Fact Sheet is not defined by the amount of data it contains, but by the quality, clarity, and governance behind it. The most successful customers focus on:
- Capturing essential information, not everything
- Ensuring each Fact Sheet has owners who maintain it
- Modeling meaningful relationships
- Keeping the Meta Model simple and scalable
- Maintaining data through the Quality Seal
When Fact Sheets follow these principles, organizations quickly unlock the full value of reports, dashboards, and transformation planning within SAP LeanIX.
Final tip : Think Backward - Only collect data or add new elements if you have a clear understanding of the specific report or insight you are trying to achieve.